Masked Frequency Modeling for
Self-Supervised Visual Pre-Training
ICLR 2023
Paper
Abstract
We present Masked Frequency Modeling (MFM), a unified frequency-domain-based approach for self-supervised pre-training of visual models. Instead of randomly inserting mask tokens to the input embeddings in the spatial domain, in this paper, we shift the perspective to the frequency domain. Specifically, MFM first masks out a portion of frequency components of the input image and then predicts the missing frequencies on the frequency spectrum. Our key insight is that predicting masked components in the frequency domain is more ideal to reveal underlying image patterns rather than predicting masked patches in the spatial domain, due to the heavy spatial redundancy. Our findings suggest that with the right configuration of mask-and-predict strategy, both the structural information within high-frequency components and the low-level statistics among low-frequency counterparts are useful in learning good representations. For the first time, MFM demonstrates that, for both ViT and CNN, a simple non-Siamese framework can learn meaningful representations even using none of the following: (i) extra data, (ii) extra model, (iii) mask token. Experimental results on image classification and semantic segmentation, as well as several robustness benchmarks show the competitive performance and advanced robustness of MFM compared with recent masked image modeling approaches. Furthermore, we also comprehensively investigate the effectiveness of classical image restoration tasks for representation learning from a unified frequency perspective and reveal their intriguing relations with our MFM approach.
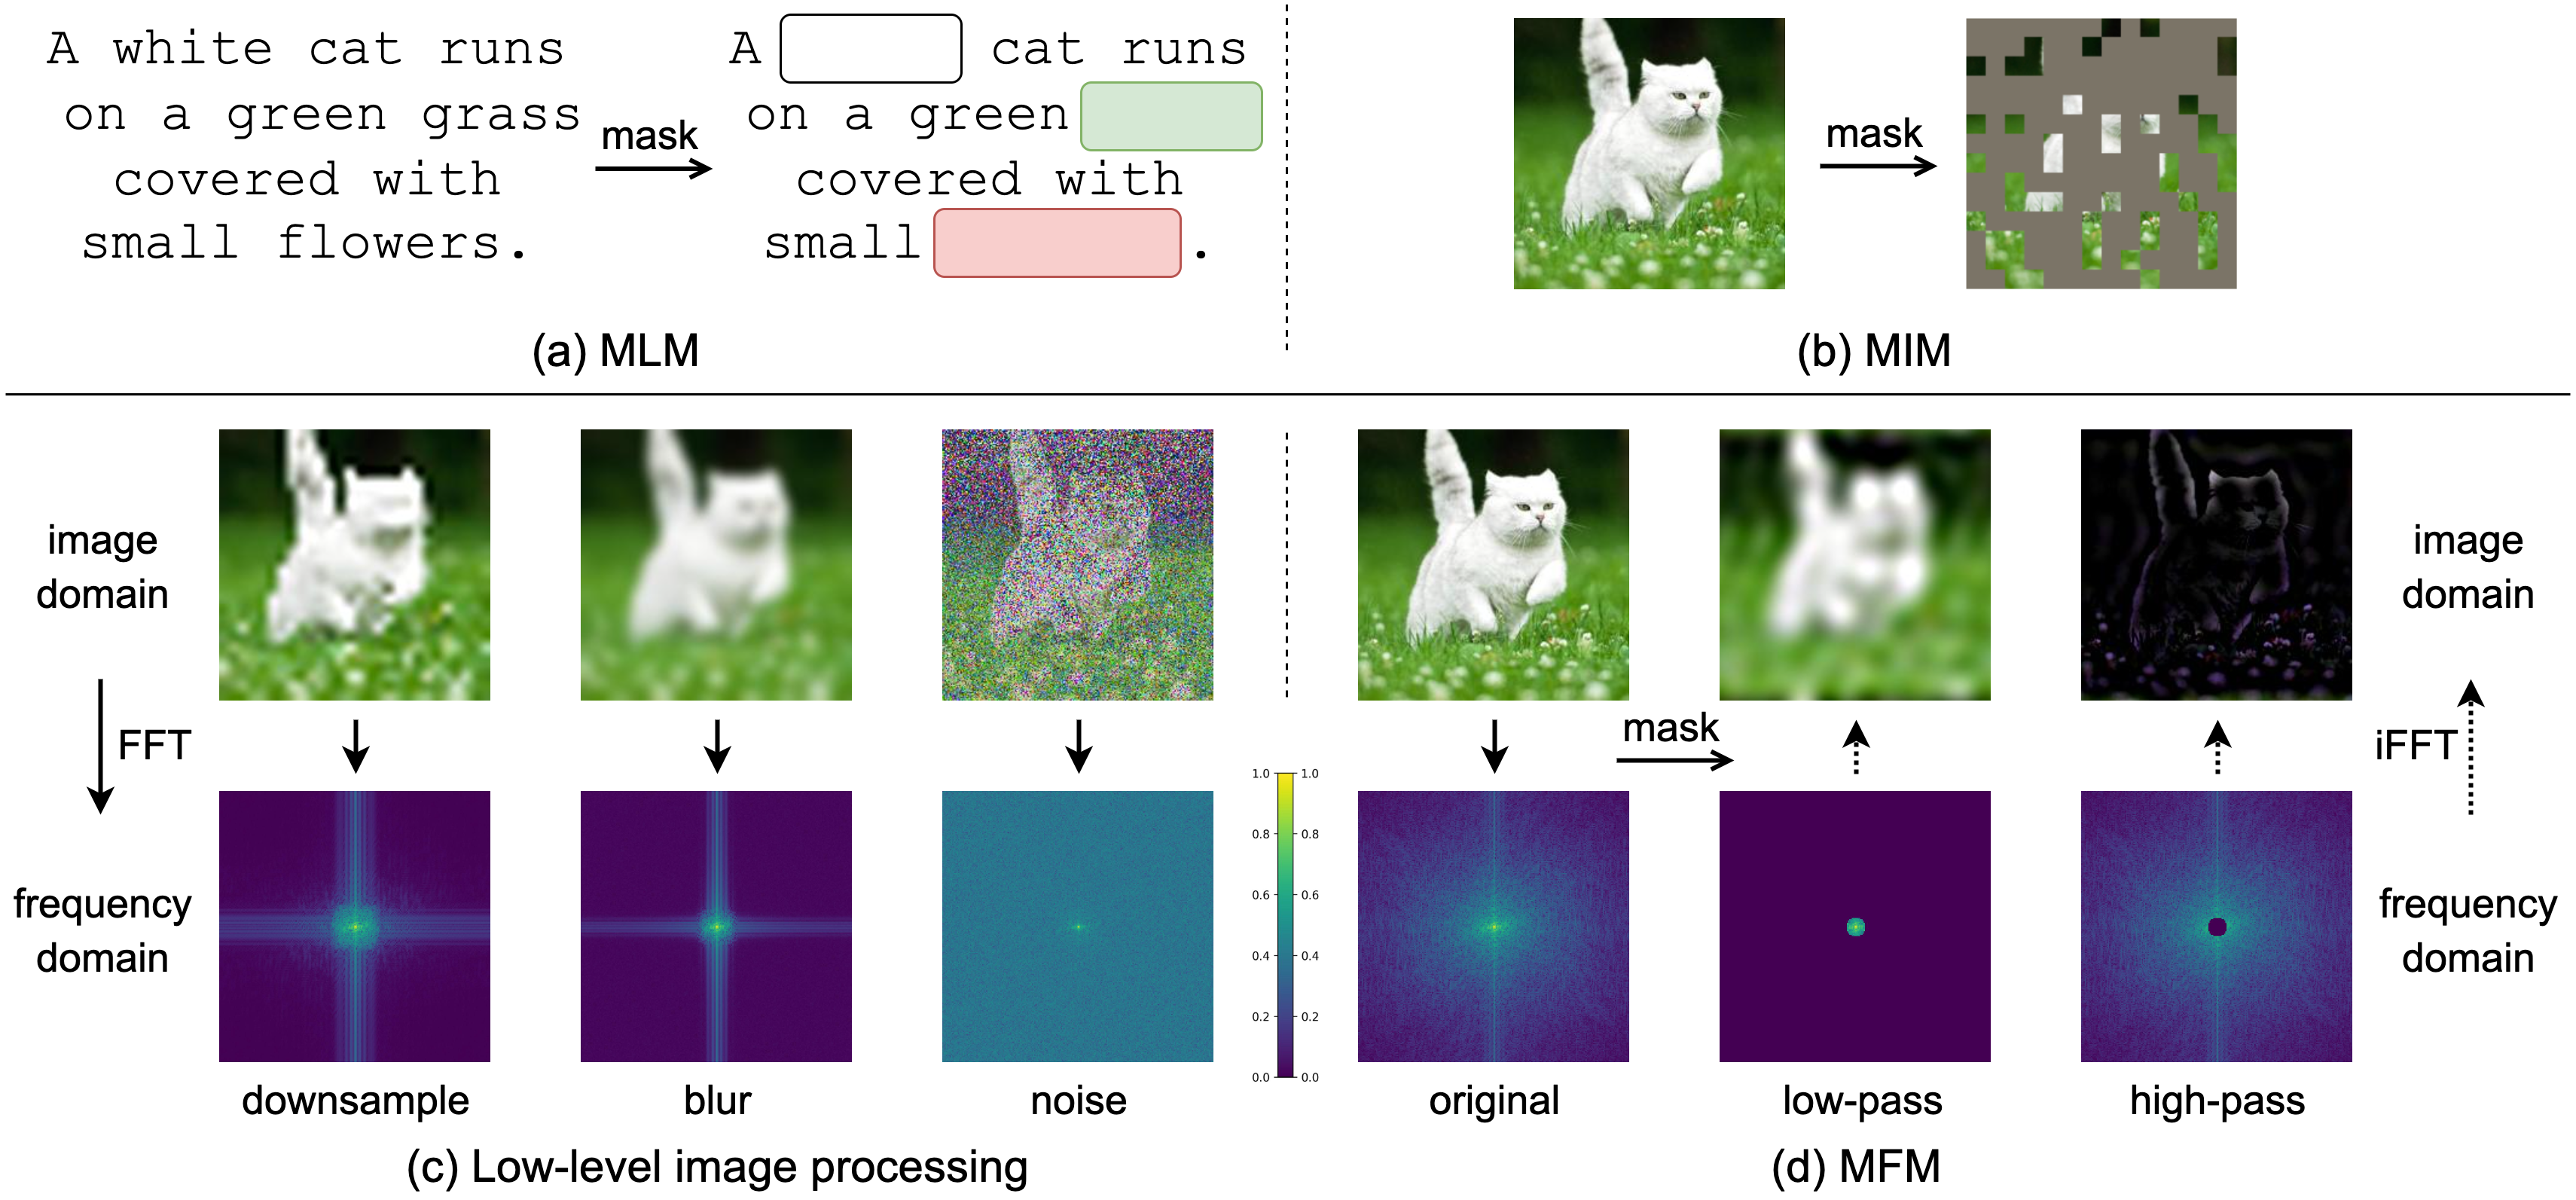
Comparison of masking recipes in Masked Language Modeling (MLM), Masked Image Modeling (MIM), low-level image processing and Masked Frequency Modeling (MFM). Note the differences of masked information among MIM, low-level image processing and MFM.
The
MFM Pipeline
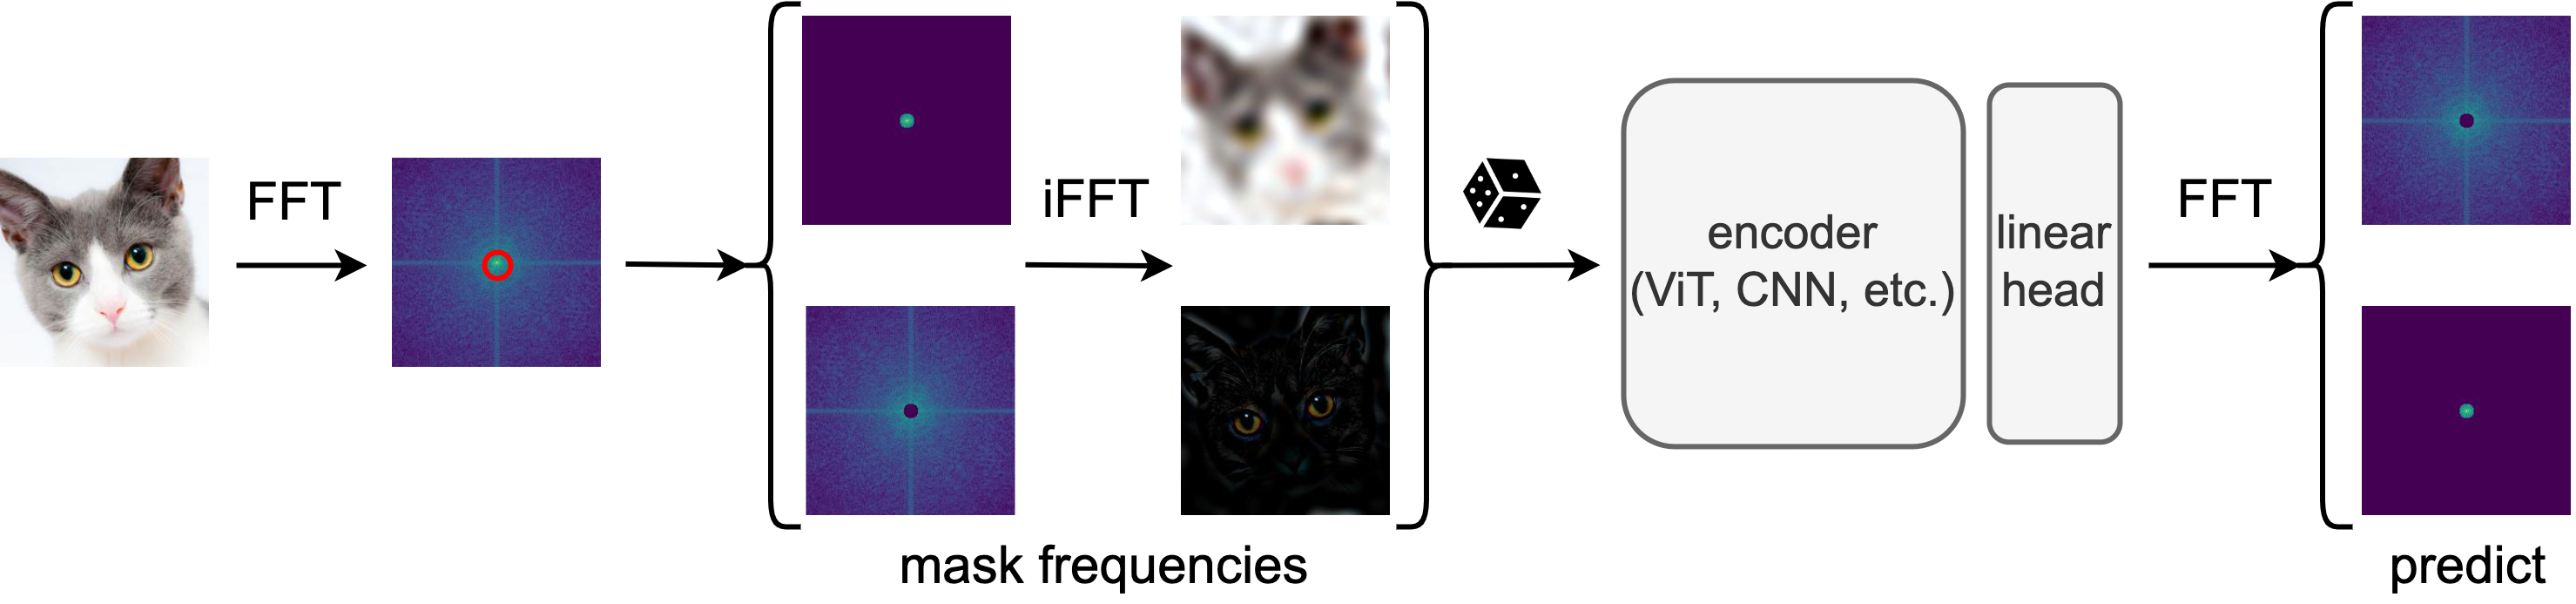
We convert each input image into frequency domain via Fast Fourier Transform (FFT) and mask a portion of frequencies on the frequency spectrum via a low-/high-pass filter. After inverse FFT (iFFT), the low-/high-pass filtered spatial images are then randomly fed to the encoder (e.g., ViT, CNN), with a lightweight one-layer head to predict the masked frequency values on the frequency spectrum via a frequency loss.
Diagnosis
of Low-Level Image Processing Tasks
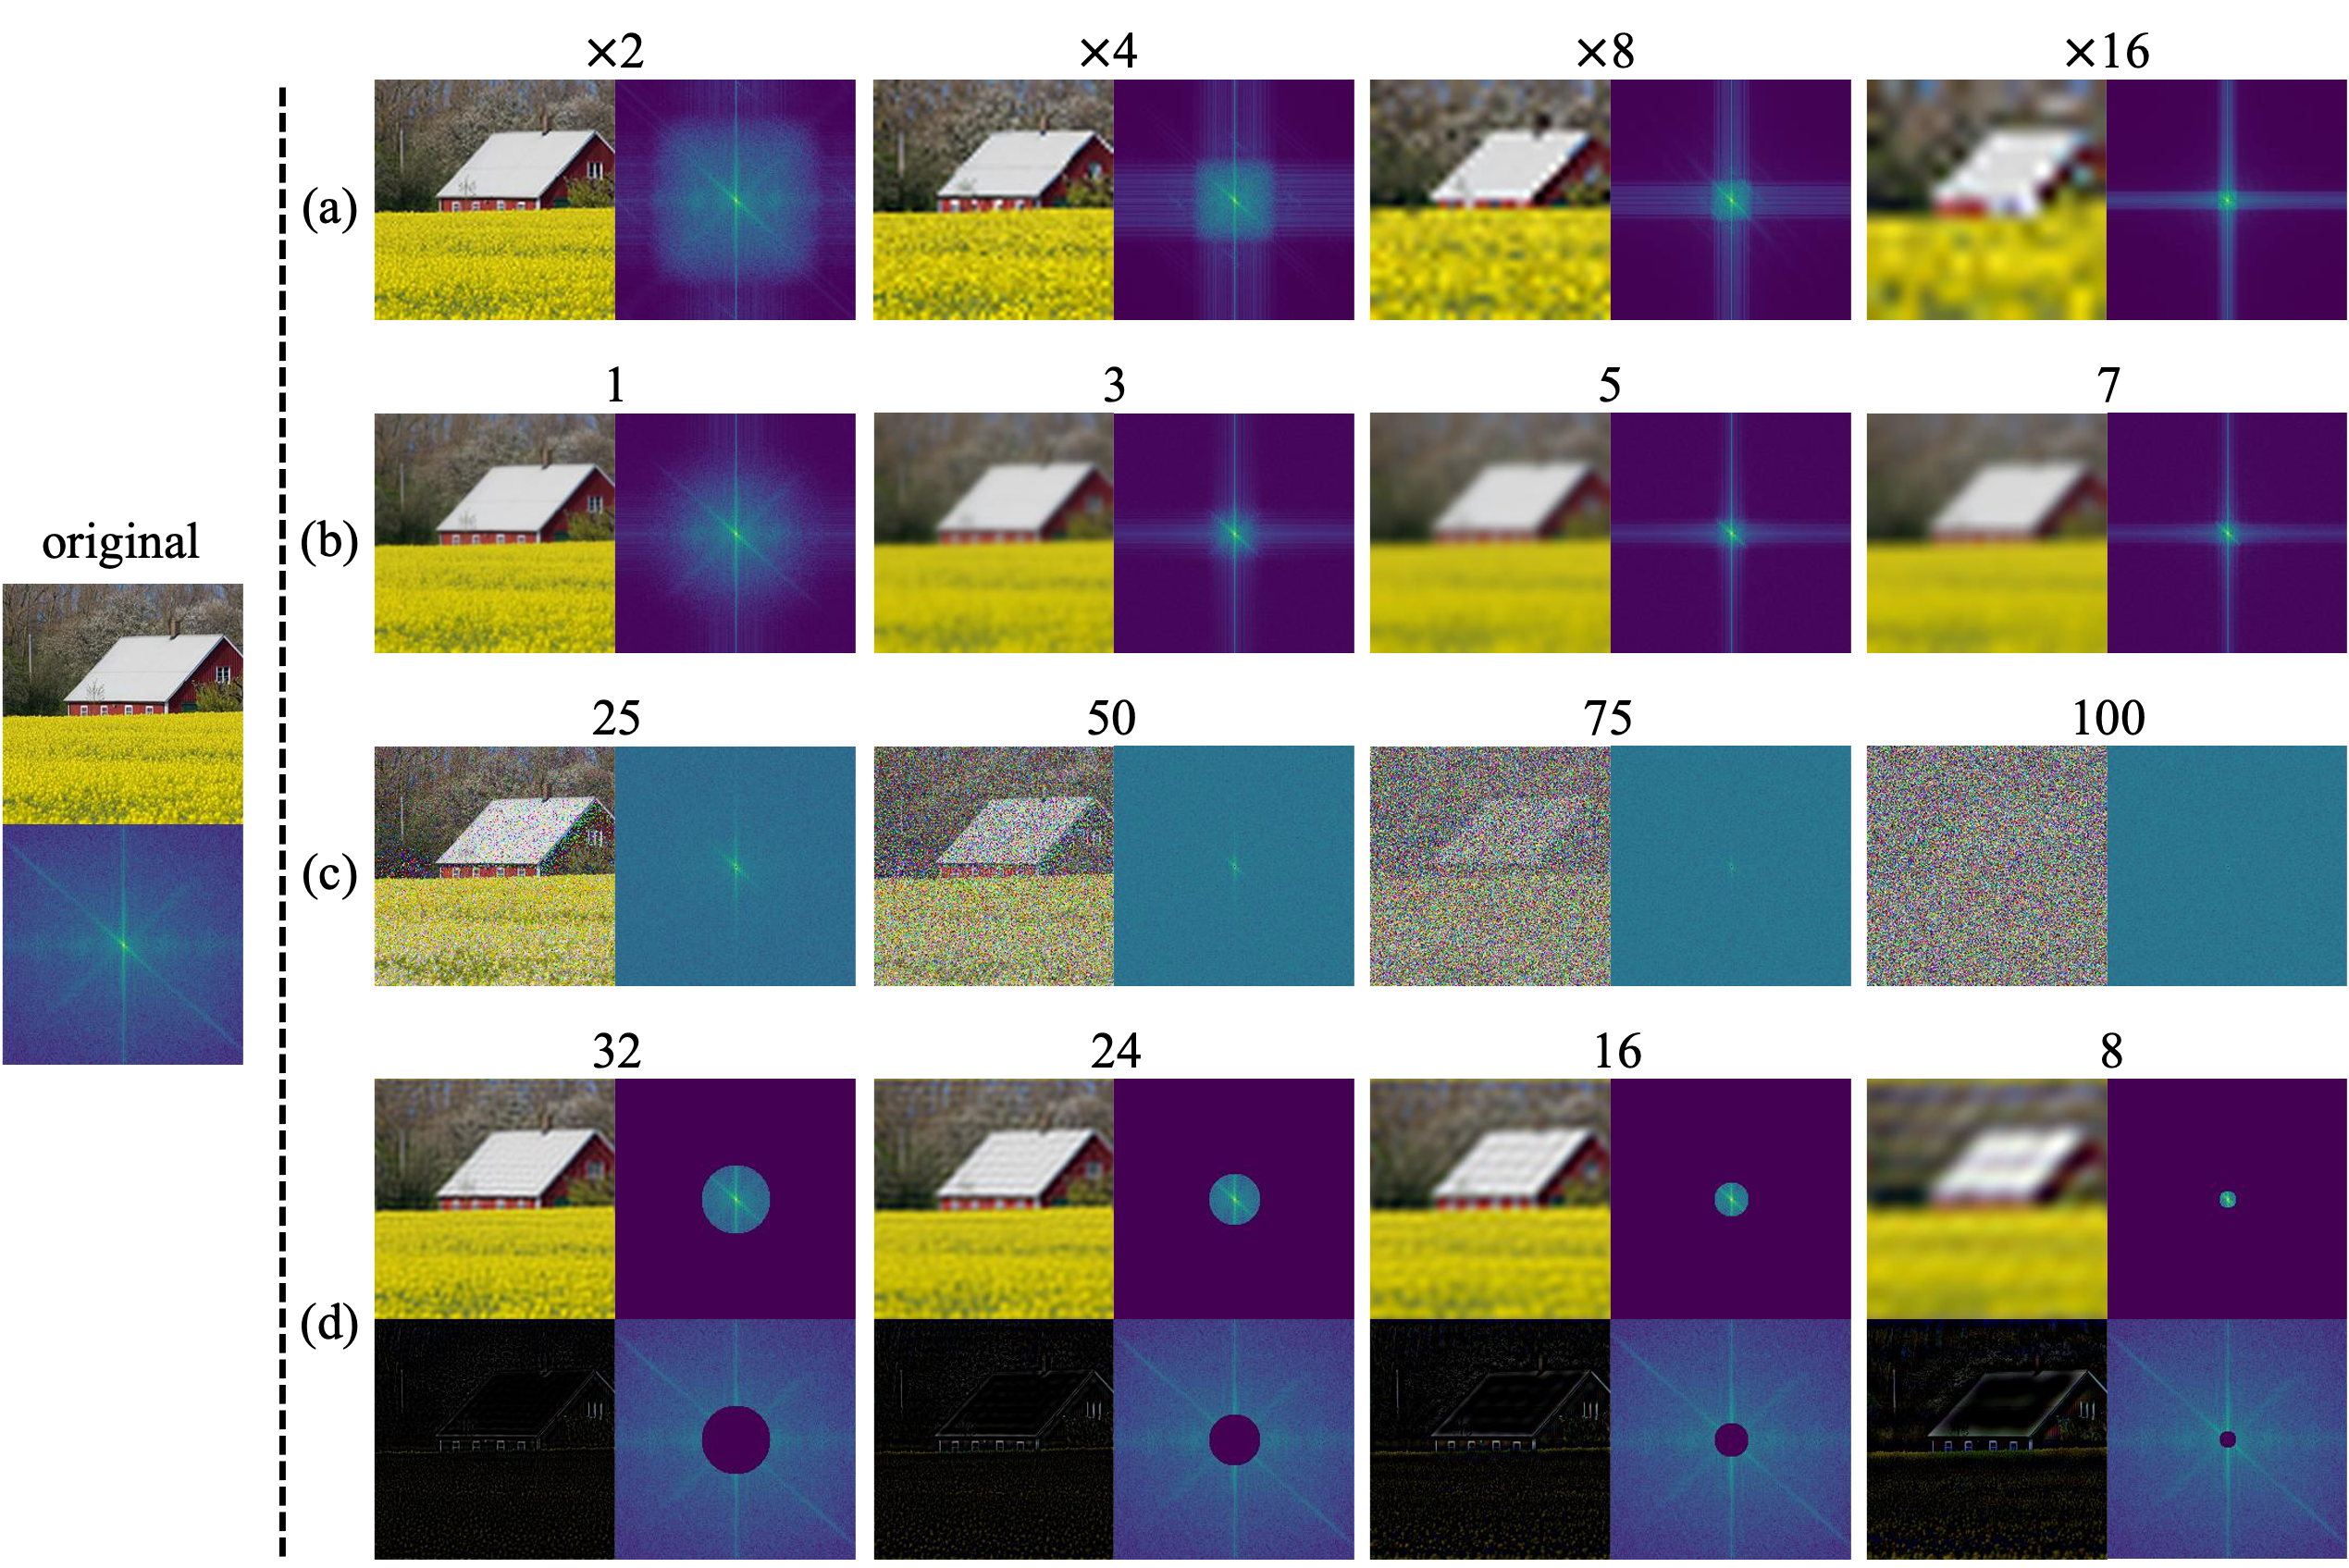
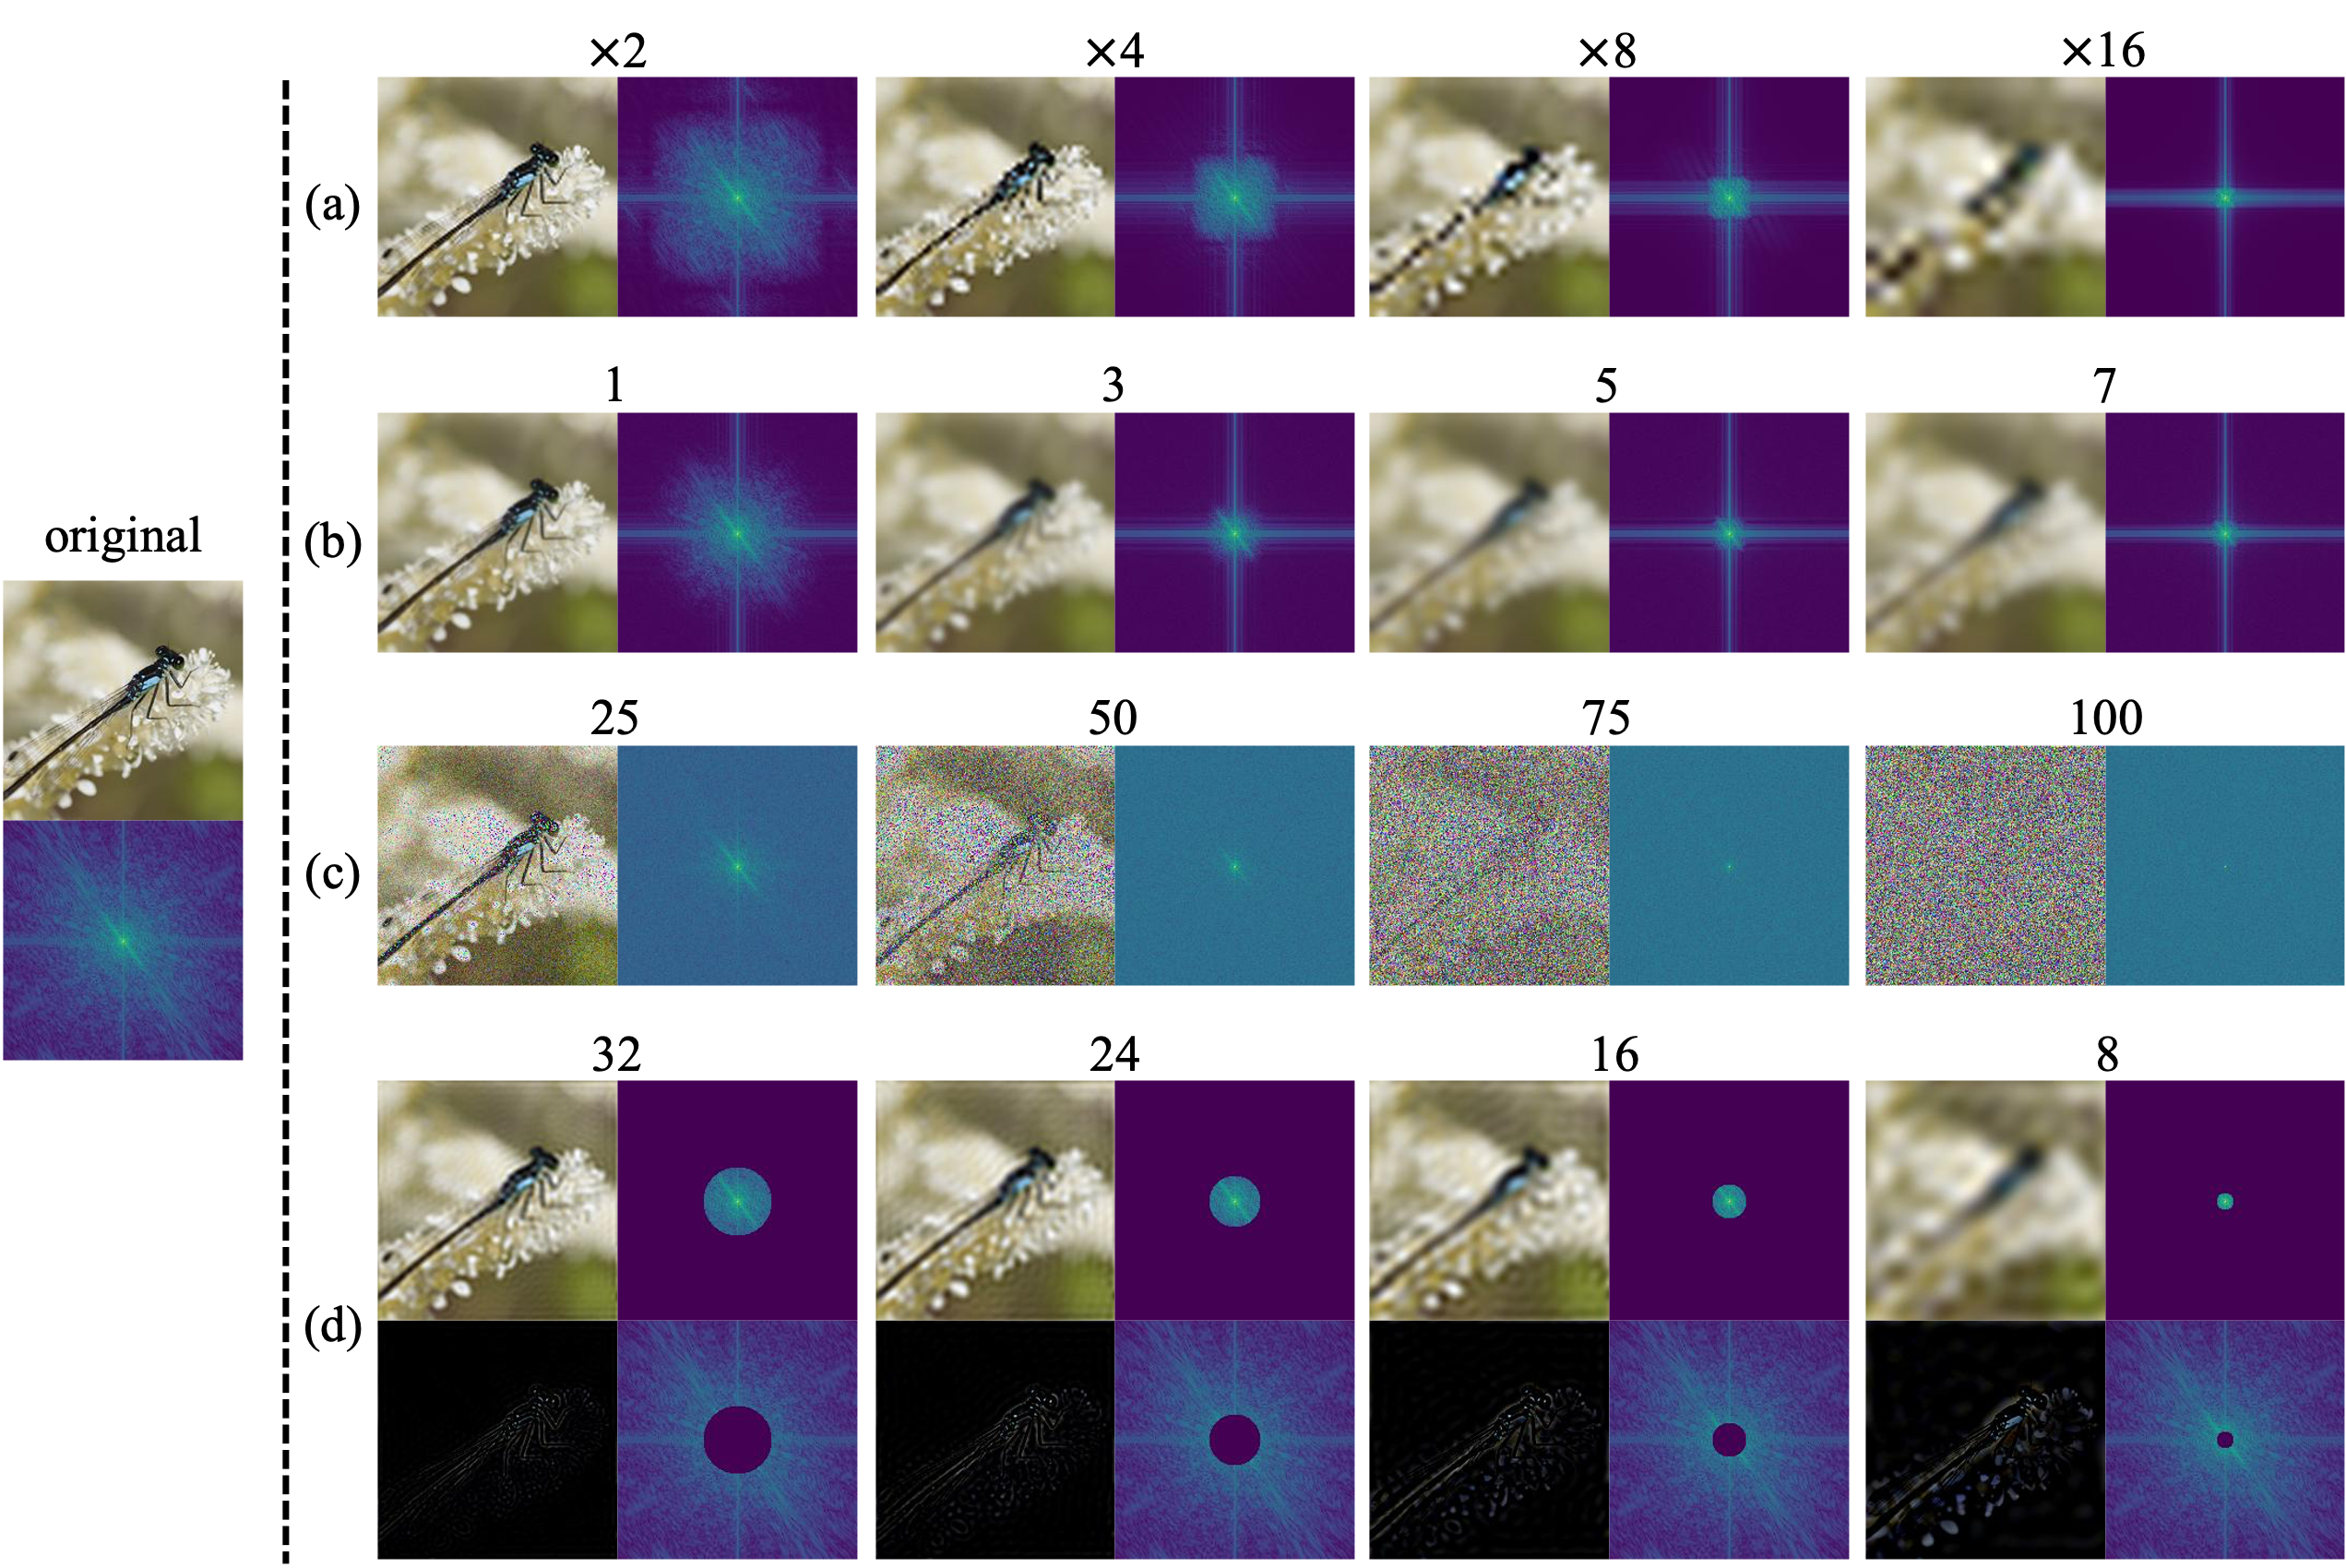
We examine the representation learning capability of three representative low-level image processing tasks (i.e., image super-resolution (SR), deblurring, and denoising) from a unified frequency perspective. We observe that: 1) The optimal degradation level of each task in the context of representation learning is much heavier than its original task setting. 2) With right configuration of the task difficulty, all these low-level tasks can achieve comparable or even better performance than their supervised counterpart (e.g., 81.8% in DeiT). 3) Representation learning benefits from all lens of frequencies. Compared with these tasks, MFM provides a more general and unified frequency perspective to perform low-level corruptions while being conceptually simpler: we directly remove certain frequencies on the frequency spectrum via a low-/high-pass filter.
Table 1: Comparison of SR, deblurring, denoising and MFM tasks with ViT-B/16 on ImageNet-1K. All models are pre-trained for 300 epochs, and evaluated with top-1 fine-tuning accuracy. Corrupted image samples from ImageNet-1K training set with different degradation levels are visualized in both image and frequency domain. The studied hyper-parameter that controls the difficulty of degradation for each task is (a) downsampling scale factor, (b) Gaussian blur sigma, (c) Gaussian noise sigma, and (d) mask radius, respectively.
| Task | Param. | Top-1 acc |
|---|---|---|
| SR | x2 | 82.1 |
| x4 | 82.2 | |
| x8 | 82.4 | |
| x16 | 82.1 |
| Task | Param. | Top-1 acc |
|---|---|---|
| Deblur | 1 | 79.7 |
| 3 | 81.2 | |
| 5 | 81.7 | |
| 7 | 81.5 |
| Task | Param. | Top-1 acc |
|---|---|---|
| Denoise | 25 | 82.4 |
| 50 | 82.6 | |
| 75 | 82.7 | |
| 100 | 82.6 |
| Task | Param. | Top-1 acc |
|---|---|---|
| MFM | 8 | 82.8 |
| 16 | 83.1 | |
| 24 | 82.7 | |
| 32 | 82.6 |
Comparison
with Previous Methods
ViT
Compared with other representative self-supervised learners, MFM can achieve comparable performance with fewer pre-training epochs while using none of the following: (i) extra data, (ii) extra model, (iii) mask token.
| Method | Pre-train data | Extra model | Mask token | Epochs | ViT-S | ViT-B |
|---|---|---|---|---|---|---|
| Scratch | - | - | - | - | 79.9 | 81.8 |
| MoCo v3 | IN-1K | momentum ViT | - | 600 | 81.4 | 83.2 |
| DINO | IN-1K | momentum ViT | - | 1600 | 81.5 | 82.8 |
| BEiT | IN-1K+DALL-E | dVAE | ✔ | 300 | 81.3 | 82.9 |
| MAE | IN-1K | - | ✔ | 300 | 80.6 | 82.9 |
| SR | IN-1K | - | - | 300 | 80.8 | 82.4 |
| Deblur | IN-1K | - | - | 300 | 79.4 | 81.7 |
| Denoise | IN-1K | - | - | 300 | 81.1 | 82.7 |
| MFM | IN-1K | - | - | 300 | 81.6 | 83.1 |
ResNet-50
Different from ViT, we observe performance degeneration of low-level image processing tasks like SR, deblurring and denoising compared with the RSB training-from-scratch baseline. We hypothesize this discrepancy is due to the architectural difference between ViT and CNN. Compared with ViT, the convolution operation in CNN tends to be more effective in capturing high-frequency components. Thus, encouraging a CNN model to reconstruct high-frequency components of images brings no benefits to the performance. Instead, learning high-frequency information can compensate for the ability of ViT models in capturing the high-frequency components. In contrast, MFM outperforms its supervised counterparts in both ViT and CNN architectures as it leverages both low- and high-frequency components.
Table 3: ImageNet-1K top-1 fine-tuning accuracy of self-supervised models using ResNet-50 as the encoder.
| Method | Epochs | Top-1 acc |
|---|---|---|
| Original90 | - | 75.3 |
| PyTorch90 | - | 76.1 |
| FixRes120 | - | 77.0 |
| DeiT300 | - | 78.4 |
| ResNet-RS350 | - | 78.8 |
| FAMS400 | - | 79.5 |
| Method | Epochs | Top-1 acc |
|---|---|---|
| RSB A3 | - | 78.1 |
| SR | 300 | 77.9 |
| Deblur | 300 | 78.0 |
| Denoise | 300 | 77.5 |
| MFM | 300 | 78.5 |
Robustness
Evaluation
We evaluate the robustness of our models on a series of benchmarks in three aspects: (i) adversarial robustness (FGSM, PGD and ImageNet-A), (ii) common corruption robustness (ImageNet-C), and (iii) out-of-distribution robustness (ImageNet-R and ImageNet-Sketch). We can conclude three observations: 1) Transformer-based models (e.g., ViT) are more robust than the CNN counterparts (e.g., ResNet-50). 2) Corruption-based tasks (e.g., SR, Deblur, Denoise and MFM) are generally more robust than the MIM task (e.g., MAE and SimMIM). 3) MFM achieves the best trade-off between standard performance and robustness (the robustness of MFM always ranks within the top two, while the standard accuracy is the best).
| Method | Robustness benchmarks | Orig. | |||||
|---|---|---|---|---|---|---|---|
| FGSM | PGD | IN-C (↓) | IN-A | IN-R | IN-SK | ||
| Scratch | 46.3 | 21.2 | 48.5 | 28.1 | 44.7 | 32.0 | 81.8 |
| MAE | 38.9 | 11.2 | 52.3 | 31.5 | 48.3 | 33.8 | 82.9 |
| SR | 46.1 | 21.5 | 46.3 | 29.1 | 49.2 | 35.5 | 82.4 |
| Deblur | 42.5 | 17.2 | 49.2 | 25.3 | 46.9 | 33.2 | 81.7 |
| Denoise | 47.6 | 24.3 | 47.8 | 30.7 | 48.4 | 34.8 | 82.7 |
| MFM | 47.7 | 24.4 | 47.5 | 32.7 | 48.6 | 34.8 | 83.1 |
| Method | Robustness benchmarks | Orig. | |||||
|---|---|---|---|---|---|---|---|
| FGSM | PGD | IN-C (↓) | IN-A | IN-R | IN-SK | ||
| Scratch | 20.2 | 3.4 | 77.0 | 6.6 | 36.0 | 25.0 | 78.1 |
| SimMIM | 16.8 | 2.1 | 77.0 | 5.7 | 34.9 | 24.2 | 77.7 |
| SR | 17.2 | 1.9 | 73.6 | 6.5 | 35.8 | 25.4 | 77.9 |
| Deblur | 17.2 | 2.0 | 74.8 | 8.2 | 37.2 | 26.5 | 78.0 |
| Denoise | 15.8 | 1.8 | 78.0 | 7.2 | 35.6 | 24.7 | 77.5 |
| MFM | 18.5 | 2.3 | 74.2 | 9.0 | 36.9 | 26.7 | 78.5 |
Qualitative
Results
Compared with SR, Deblur and Denoise, MFM can utilize both high-frequency and low-frequency information for prediction.
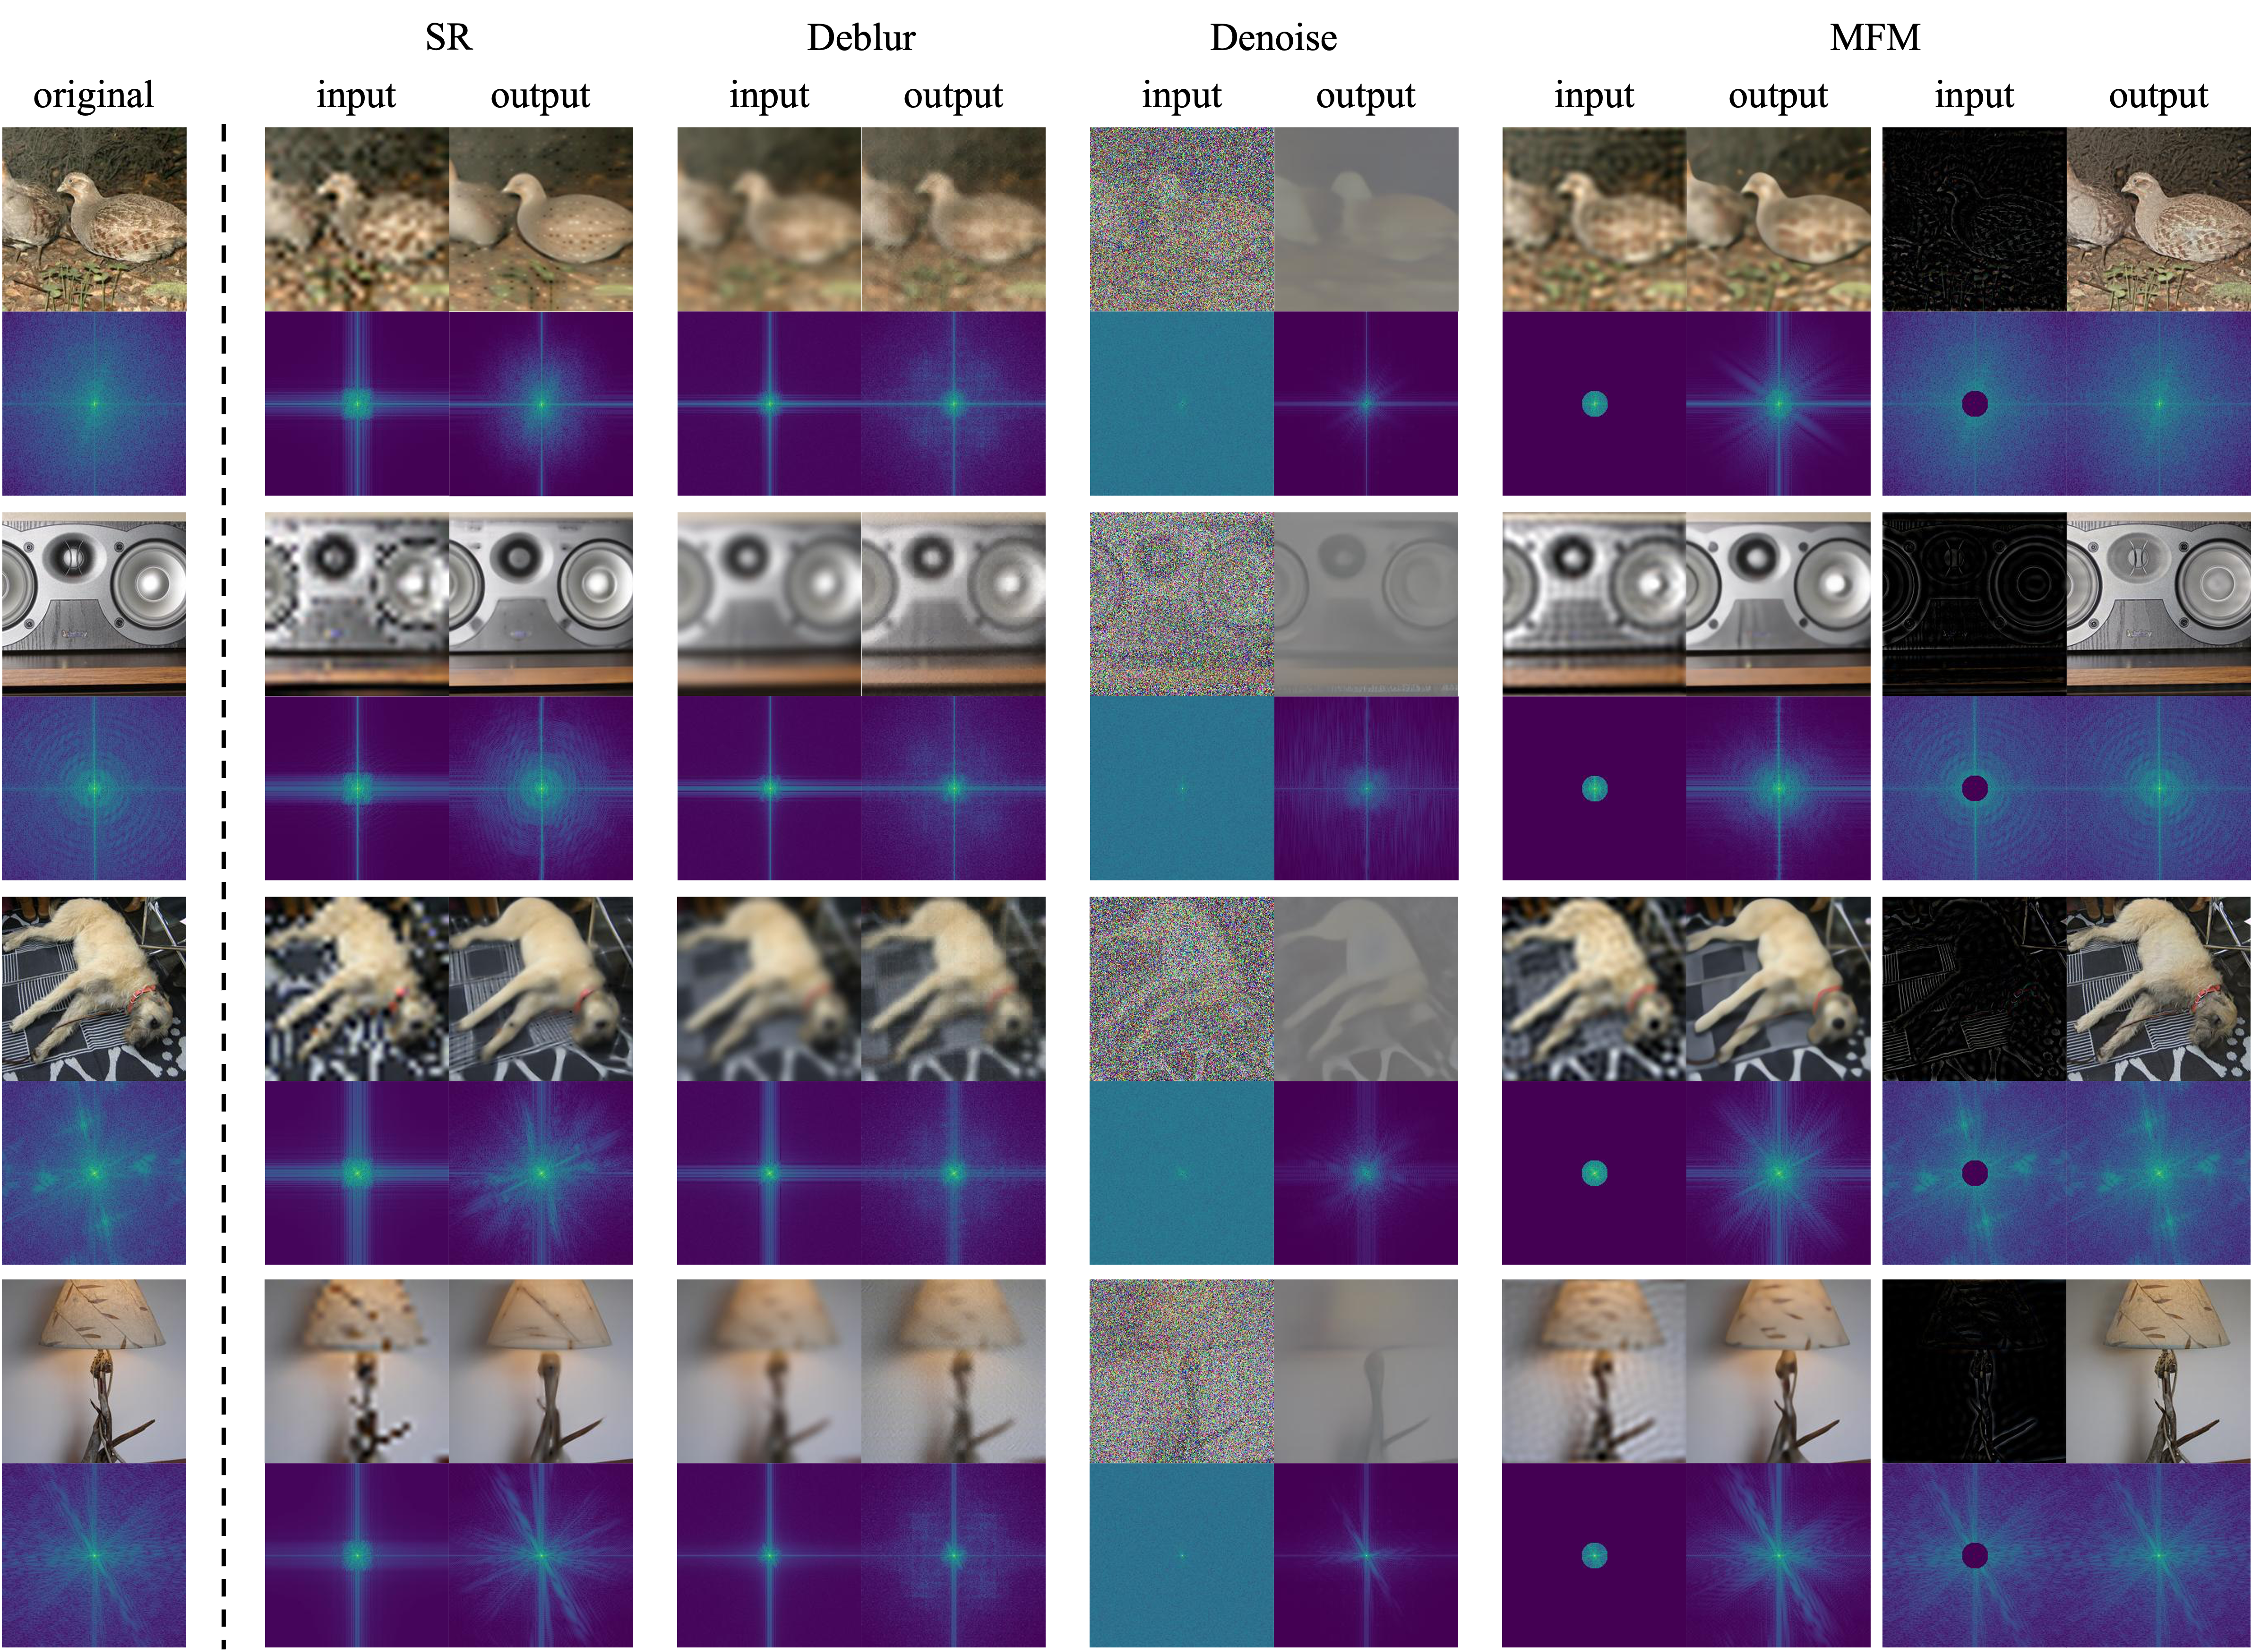
Example results of recovered images on ImageNet-1K validation set for SR, deblurring, denoising and MFM tasks. We visualize both images and their frequency spectrums. We use the best pre-trained model of each task studied in our paper for visualization, i.e., the downsampling scale factor is ×8 for SR, the Gaussian blur sigma is 5 for Deblur, the Gaussian noise sigma is 75 for Denoise, and the mask radius is 16 for MFM.
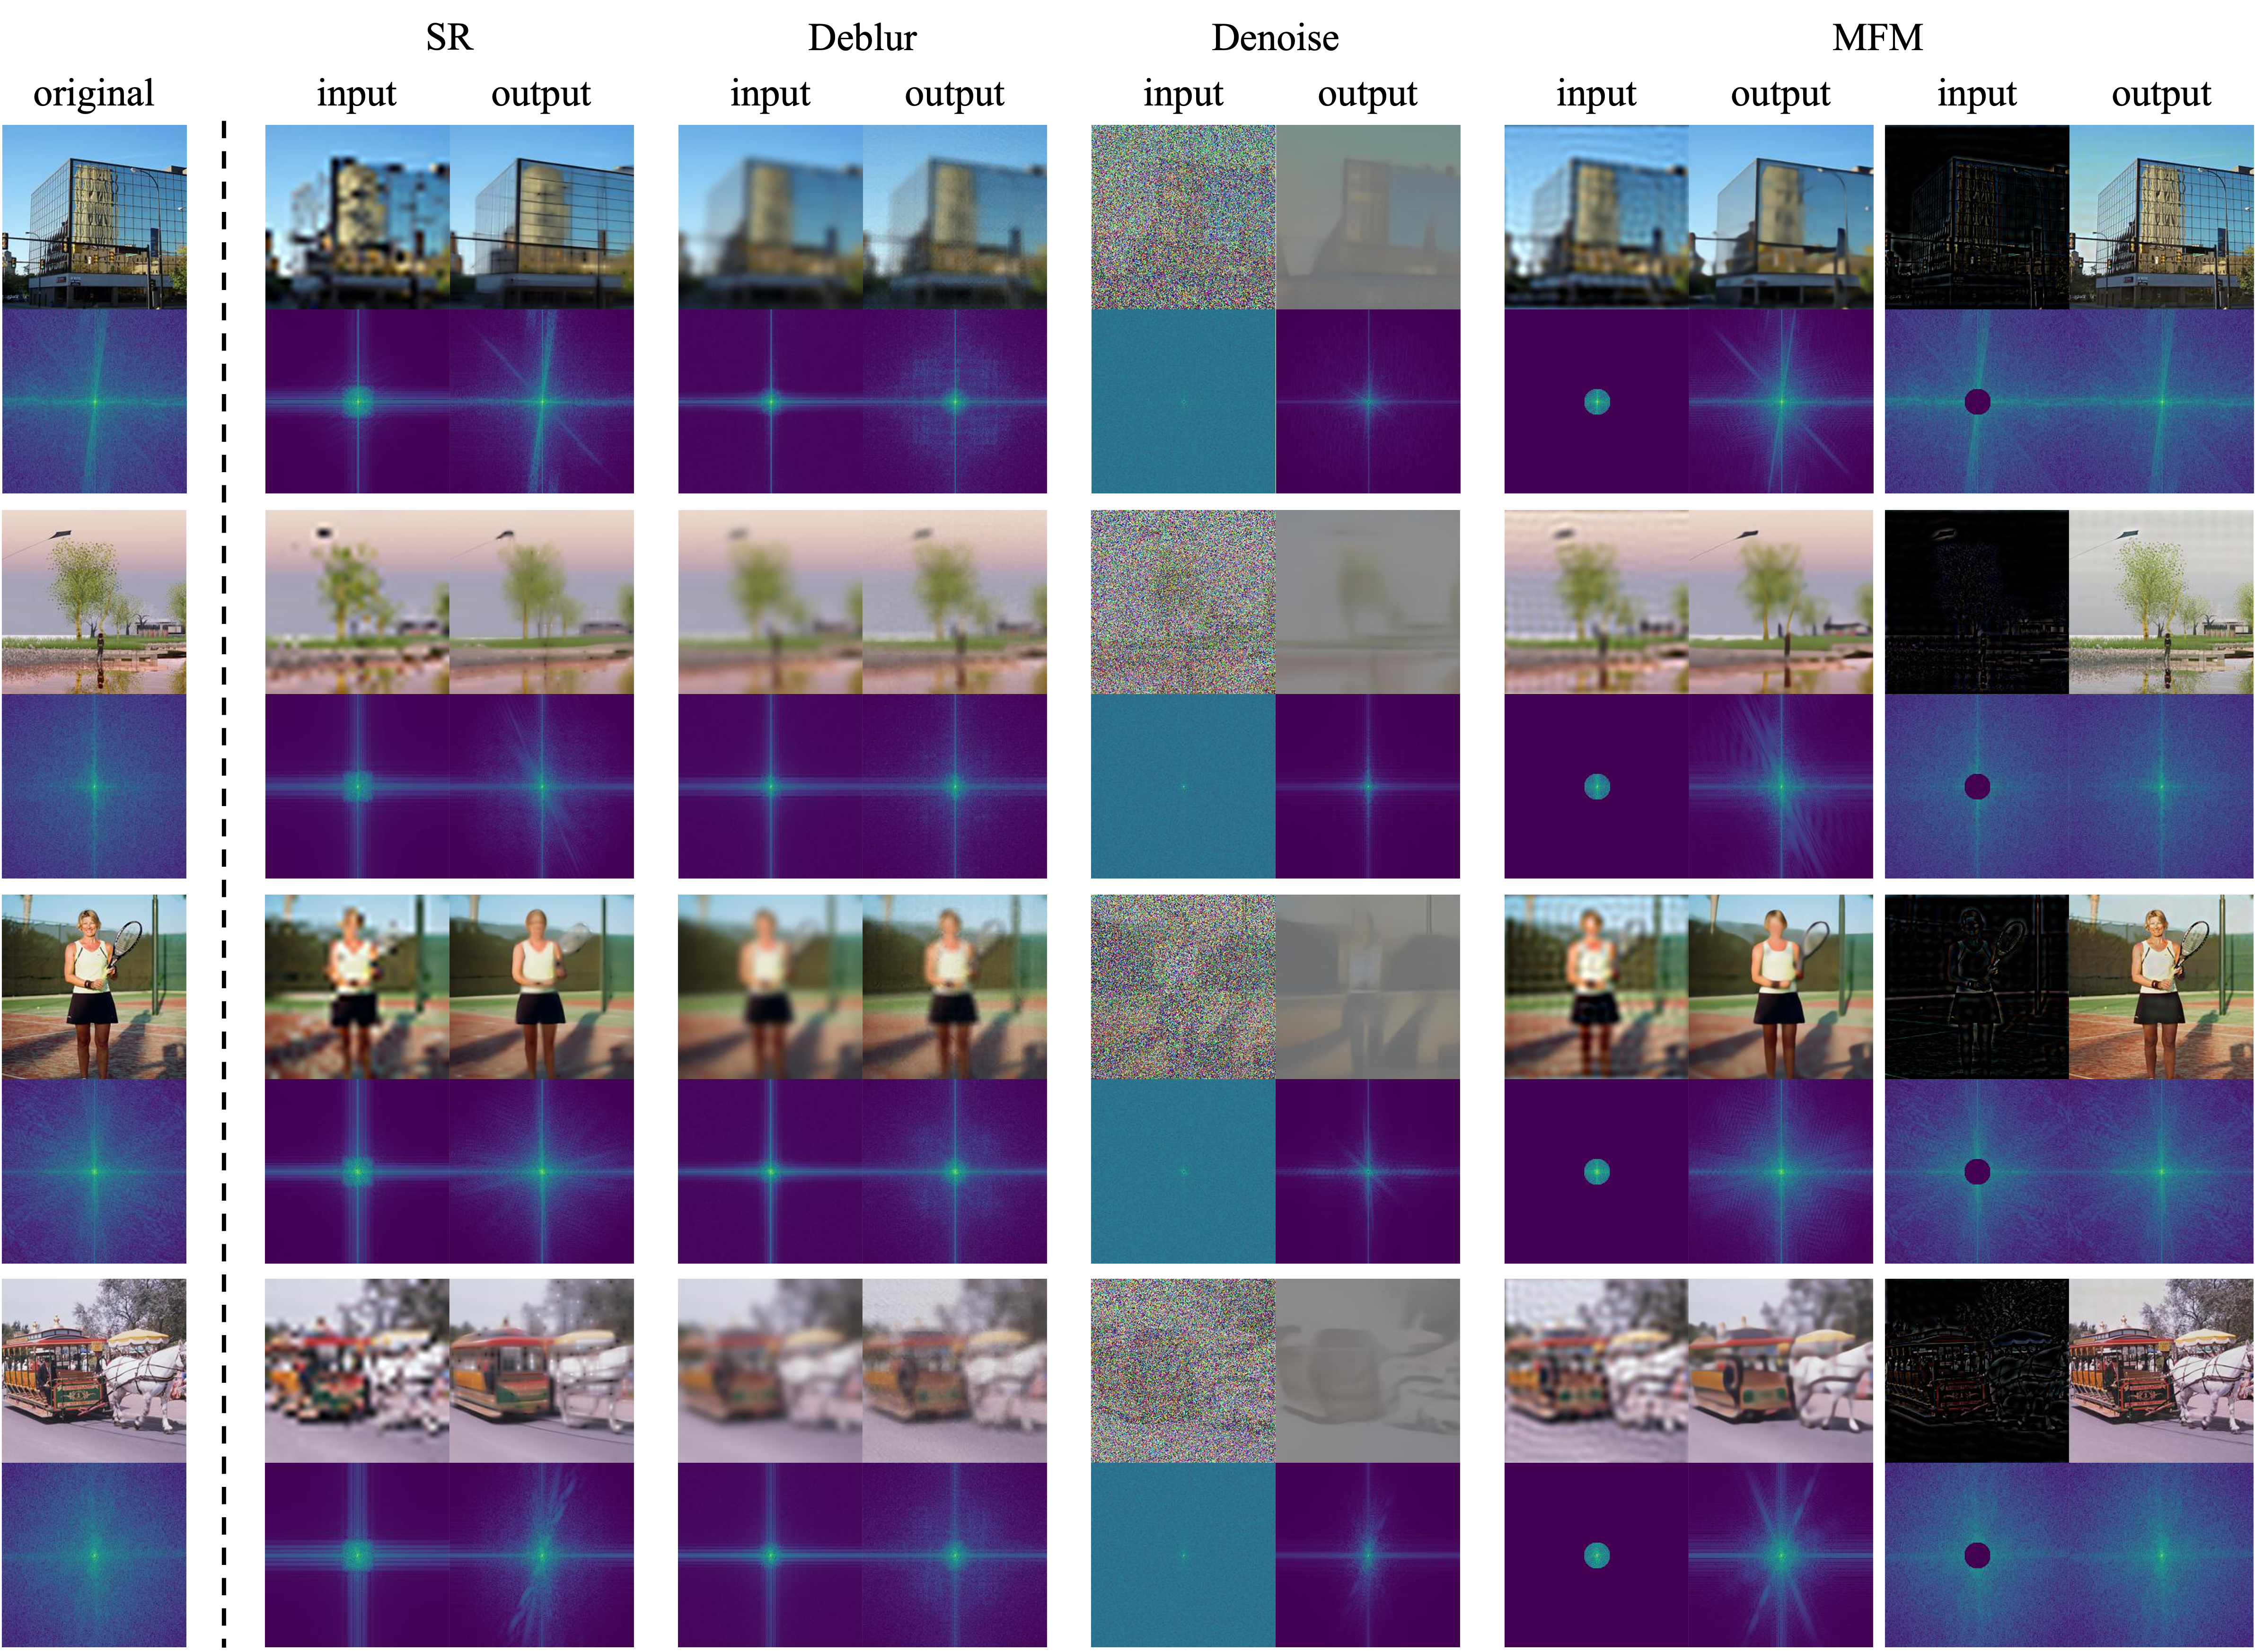
Example results of recovered images on COCO validation set for SR, deblurring, denoising and MFM tasks, using the models pre-trained on ImageNet-1K. We visualize both images and their frequency spectrums.
Paper
Citation
@inproceedings{xie2023masked,
title = {Masked Frequency Modeling for Self-Supervised Visual Pre-Training},
author = {Xie, Jiahao and Li, Wei and Zhan, Xiaohang and Liu, Ziwei and Ong, Yew Soon and Loy, Chen Change},
booktitle = {ICLR},
year = {2023}
}
Related
Projects
-
Correlational Image Modeling for Self-Supervised Visual Pre-Training
W. Li, J. Xie, C. C. Loy
in Proceedings of IEEE Conference on Computer Vision and Pattern Recognition, 2023 (CVPR)
[arXiv] [Project Page] -
Delving into Inter-Image Invariance for Unsupervised Visual Representations
J. Xie, X. Zhan, Z. Liu, Y. S. Ong, C. C. Loy
International Journal of Computer Vision, 2022 (IJCV)
[PDF] [DOI] [arXiv] [Project Page] -
Unsupervised Object-Level Representation Learning from Scene Images
J. Xie, X. Zhan, Z. Liu, Y. S. Ong, C. C. Loy
in Proceedings of Neural Information Processing Systems, 2021 (NeurIPS)
[PDF] [arXiv] [Project Page] -
Online Deep Clustering for Unsupervised Representation Learning
X. Zhan*, J. Xie*, Z. Liu, Y. S. Ong, C. C. Loy
in Proceedings of IEEE Conference on Computer Vision and Pattern Recognition, 2020 (CVPR)
[PDF] [arXiv] [Project Page]
